Fellow Body Imaging, Department of Radiology, University of Washington, Seattle, WA
Share
CEUS helps rule out pancreatic cancer
Elizabeth is a 64-year-old woman who developed pancreatitis with nausea, vomiting, and abdominal pain. A CT scan of her abdomen showed a mass-like lesion in the head of her pancreas, a potential sign of pancreatic adenocarcinoma or cancer. The mass-like lesion was obstructing her pancreatic duct leading to pancreatitis and was also obstructing her common bile duct, which is the tube that brings bile from the liver to the small bowel, leading to dilation of her bile ducts, cholangitis (inflammation of the bile ducts), and elevated bilirubin in her blood.
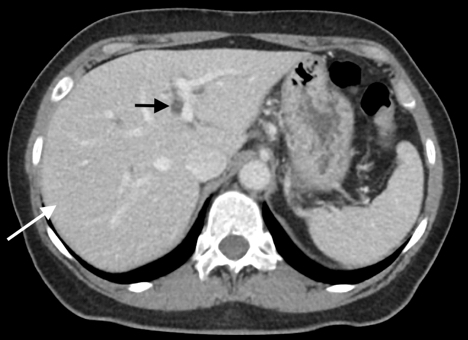
Figure 1. Contrast-enhanced CT axial image. On the left side of the image, the bile ducts in the liver are abnormally dilated (short black arrow), which are seen as the dark linear areas in the liver, which parallel the normally enhancing bright portal veins. Besides the dilated bile ducts, the liver (long white arrow) has a normal appearance.
Over the next several months, Elizabeth underwent extensive workup by the surgical and gastroenterology teams, with additional CT’s and MRI’s of her abdomen. In addition, the gastroenterologist performed three Endoscopic Retrograde Cholangiopancreaticograms (ERCP), in which a tubular scope was inserted down Elizabeth’s throat through her esophagus and stomach to her small bowel. Tissue samples of the pancreatic head mass and the common bile duct were obtained and a biliary stent was inserted to help the bile flow from Elizabeth’s liver to her small bowel. The initial tissue sampling was inconclusive for malignancy.
Six months later the third tissue sample revealed inflammatory cells with a predominance of IgG4 plasmacytes and no evidence of malignancy. However, another CT showed multiple small liver nodules measuring as large as 2 cm in diameter (Figure 2) – typical for metastatic disease or possibly infection.
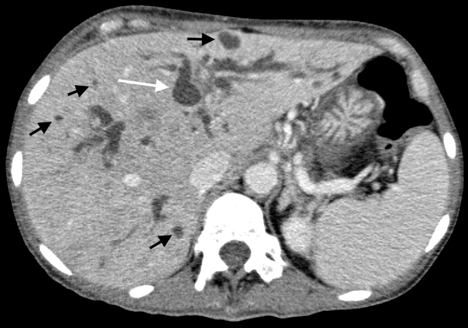
Figure 2. Contrast-enhanced CT axial image six months later: On the left side of the image, the bile ducts in the liver are now even more abnormally dilated (long white arrow) compared to prior CT scan seen in Figure 1. There are also multiple new small round nodules (black arrows), which are dark compared to the normal liver tissue.
To determine whether these nodules were either metastatic cancer, an infection, or perhaps attributable to another diagnosis, the radiology team took a tissue sample of one of the liver nodules using ultrasound guidance. The planning ultrasound scan for the biopsy, using regular grayscale mode, demonstrated only one liver nodule, seen as a hypoechoic (dark), discrete spot that corresponded directly with one of the nodules seen on the CT scan. None of the other nodules seen on the prior CT scan could be seen with regular grayscale mode on ultrasound.
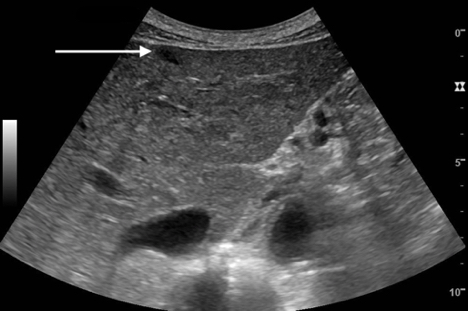
Figure 3. Ultrasound grayscale image of the liver. The long white arrow marks the 1.4 centimeter nodule just inside the liver capsule. This nodule corresponds to the largest nodule, marked with a slightly longer black arrow in Figure 3. The scale on the right is in centimeters.
The radiology team then turned to contrast-enhanced ultrasound (CEUS) in order to evaluate the other nodules seen on the CT. CEUS uses an ultrasound contrast agent comprised of a suspension of biocompatible microbubbles that are intravenously administered during the ultrasound scan. On a CEUS scan, metastatic nodules and infectious lesions would normally enhance differently when compared to normal liver tissue.
Fortunately for Elizabeth, no additional masses were identified with CEUS. This provided welcome reassurance that the nodules were not metastatic cancer or infectious.
The use of CEUS in the biopsy suite helped us to understand the likely benign nature of the nodules, since they were not seen, and reduced Elizabeth’s anxiety level when getting her liver biopsy, reassuring her that the biopsy target might not be cancerous. Elizabeth was placed on steroids to treat her condition and substantially improved over the subsequent three months, feeling much better and getting back to her normal life.
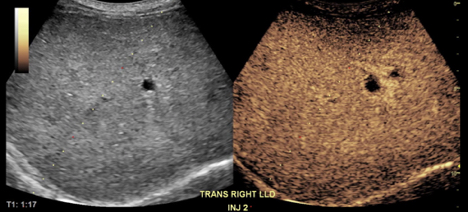
Figure 4. Axial contrast-enhanced ultrasound of the liver at a comparable level as CT image in figure 2 with paired images, on the left without contrast and on the right with contrast:
the left image is optimized to show the anatomy and the right image optimized to show the contrast bubbles. The long white arrow marks the same dilated bile duct as it is marked in figures 1 and 2. Another smaller bile duct is seen next to it on the right contrast image (second dark spot), corresponding to one of several other dilated bile ducts on CT (bile duct dilatation had moderately improved on the date of the ultrasound due to the prior stent placement). In contrast to the CT scan however contrast enhanced ultrasound does not demonstrate any masses within the liver.
A biopsy of the hypoechoic liver nodule (long arrows on figure 1 and 2) demonstrated an increased number of IgG4 plasmacytes, just like the pancreatic head abnormality. No tumor cells were found. This confirmed the diagnosis of IgG4-related disease and excluded the more worrisome diagnosis of pancreatic cancer.